Web Dashboard
PgQueuer ships a built-in web dashboard for queue insights and job management: backlog age, throughput, execution-duration percentiles, failures with tracebacks, worker liveness, schedules, and table health, plus requeue and cancel actions. It is pure Python (FastAPI + htmx, no JavaScript build step) and reads the tables PgQueuer already maintains, so there is no schema migration to run.
Installation
Running standalone
Connection settings follow the same rules as every other pgq command:
--pg-dsn, PGDSN, or the standard libpq env vars (PGHOST, PGUSER, ...).
--host and --port can also be set through PGQUEUER_WEB_HOST and
PGQUEUER_WEB_PORT, which is how the Docker image configures them.
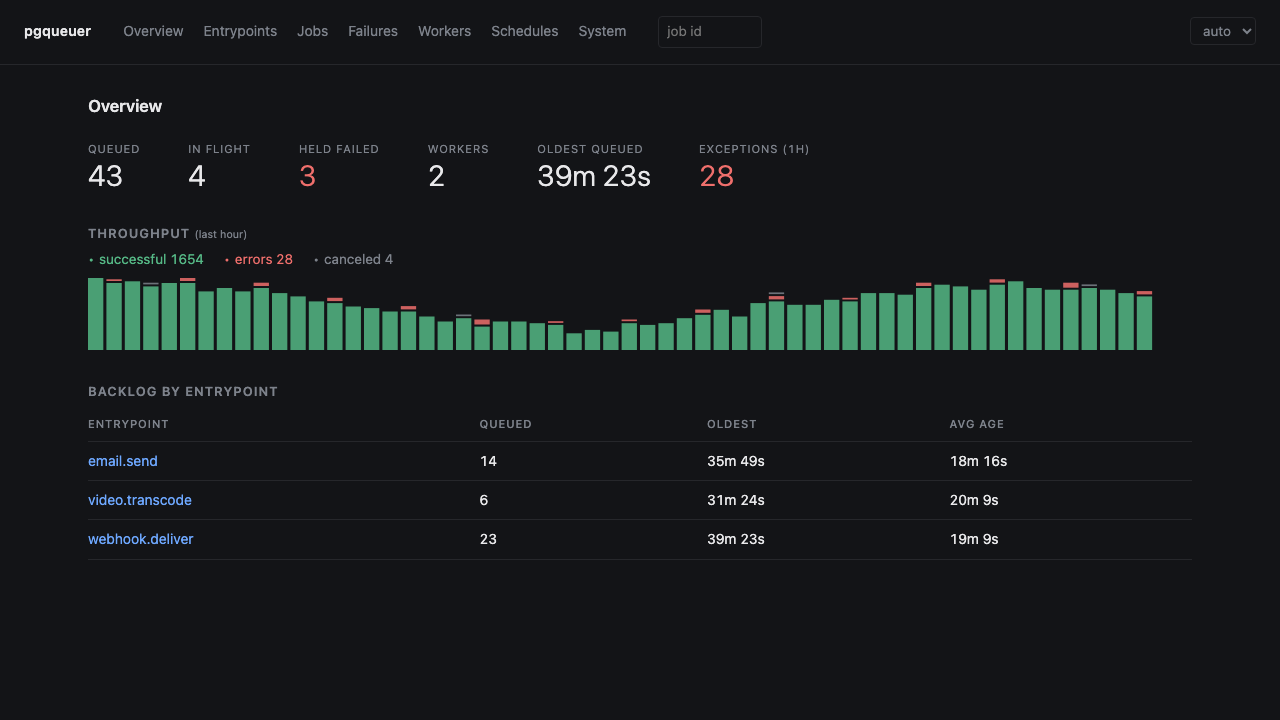
The other screens drill into the same data: per-entrypoint durations and
failure rates, a browsable job table with per-job detail, held failures with
bulk requeue, workers, schedules, and system health. Orchestrators can hit
/healthz for liveness.
Live updates ride the LISTEN/NOTIFY channel PgQueuer already installs:
queue-table changes push a debounced server-sent event and the affected
screens re-render. Statistics-derived views (throughput, durations) refresh on
a timer instead, since the notify trigger only covers the queue table.
Authentication
The dashboard is open by default, like comparable tools (River UI). It can cancel and requeue jobs, so never expose it unauthenticated beyond localhost. Enable HTTP Basic auth via environment variables:
Embedding in your own FastAPI app
The router is mountable, so you can wrap it in your own auth middleware or
dependencies. Set app.state.pgq_queries in your lifespan:
from contextlib import asynccontextmanager

import asyncpg
from fastapi import Depends, FastAPI

from pgqueuer.db import AsyncpgPoolDriver
from pgqueuer.queries import Queries
from pgqueuer.web import create_web_router


@asynccontextmanager
async def lifespan(app: FastAPI):
    async with asyncpg.create_pool(min_size=2) as pool:
        app.state.pgq_queries = Queries(AsyncpgPoolDriver(pool))
        yield


app = FastAPI(lifespan=lifespan)
app.include_router(
    create_web_router(dependencies=[Depends(my_auth)], include_sse=False),
    prefix="/pgqueuer",
)
With include_sse=False no broadcaster is required and live regions fall back
to their polling triggers. To keep server-sent events when embedding, start a
pgqueuer.adapters.web.sse.Broadcaster in your lifespan and store it as
app.state.pgq_broadcaster.
Docker
A ready-made image definition lives at tools/web/Dockerfile, with a compose
example in tools/web/docker-compose.yml:
docker build -f tools/web/Dockerfile -t pgqueuer-dashboard .
docker run -e PGHOST=db -e PGUSER=... -p 8080:8080 pgqueuer-dashboard
Reusing the insights API
The dashboard is one frontend over pgqueuer.core.insights. Any code can
consume the same getters, whether from a one-off script or a metrics exporter:
from pgqueuer.core.insights import InsightsService, QueueManagementService

insights = InsightsService(queries)
snapshot = await insights.overview()
per_entrypoint = await insights.entrypoint_stats()

management = QueueManagementService(queries)
await management.requeue([job_id])
Performance notes
- Duration percentiles are derived on the fly from
pgqueuer_logstate transitions. Queries are bounded to a selectable window (1h/6h/24h, capped at 24h) and served by the log table'screatedindex. - Jobs picked before the window start lose their pick/complete pair and are omitted from percentiles (undercounted, never miscounted).
- NOTIFY storms are debounced (250 ms) before fanning out to SSE clients, and the listener uses a dedicated connection so page renders are never starved.